This site uses cookies to improve your experience. To help us insure we adhere to various privacy regulations, please select your country/region of residence. If you do not select a country, we will assume you are from the United States. Select your Cookie Settings or view our Privacy Policy and Terms of Use.
Cookie Settings
Cookies and similar technologies are used on this website for proper function of the website, for tracking performance analytics and for marketing purposes. We and some of our third-party providers may use cookie data for various purposes. Please review the cookie settings below and choose your preference.
Used for the proper function of the website
Used for monitoring website traffic and interactions
Cookie Settings
Cookies and similar technologies are used on this website for proper function of the website, for tracking performance analytics and for marketing purposes. We and some of our third-party providers may use cookie data for various purposes. Please review the cookie settings below and choose your preference.
Strictly Necessary: Used for the proper function of the website
Performance/Analytics: Used for monitoring website traffic and interactions
The map highlights infrastructure and transportation improvements that can create greater access to the distressed areas, making them more attractive to investors.
The British Geological Survey (BGS) has launched hazard mapping tools showing the risk of earthquakes in the UK’s exclusive economic zone (EEZ) to support offshore energy developments. The post Offshore earthquake risk map to support energy developments in UK waters launched appeared first on New Civil Engineer.
The ARC JV, led by Michael Baker International, is under a five-year, $300 million maximum value contract to provide technical expertise across FEMA’s Zone 1, including generating/evaluating flood hazard and risk information, along with mitigation, planning, flood mapping and modeling activities.
ibush Wed, 01/17/2024 - 10:54 A new report maps out a path for residential new construction and retrofits to reach urgent climate goals A new report by the U.S. climate zones. What Will It Take to Bring All New and Existing Construction to Net Zero?
per month in Climate Zone 2 (see map below) and $0.92 per month in Climate Zone 3 for a standard 2,500 square-foot single-family house, yet it costs roughly $1,366 to achieve that level of insulation. The analysis indicated average energy savings of $0.67 Another example is continuous wall insulation.
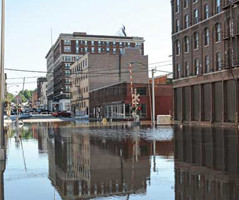
North Carolina officials will not rely on FEMA to identify high-risk flood zones. Officials say FEMA maps have not been updated quickly enough based on recent experience. As proof, they say that more than 77% of homes damaged by Hurricane Matthew in 2016 were not located in federally designated flood zones.
To help define and locate high-risk areas, the EPA has created a radon zonemap (see below) showing the potential for radon at the county level across the country. Zone 1” (in red on the map) has the highest potential levels of radon, “Zone 2” (orange) has moderate levels, and “Zone 3” has the lowest likelihood of radon concentrations.
After a recent successful challenge of the scientific methodology used to redraw the coastal high-hazard zones, the Massachusetts congressional delegation is asking federal officials to put the brakes on new flood zonemaps for the Bay State. read more.
These experts offer services such as boundary surveys, topographical mapping, and utility location, all of which are essential for accurate planning. This process involves more than just measuring property lines; it includes evaluating the terrain, identifying potential obstacles, and mapping out utilities.
This piece explores the importance of using maps that showcase property ownership specifics, emphasizing the benefits and uses across various fields. The use of property owner maps provides information on ownership trends, helping buyers locate property owners in a given area.
Consolidating the development zone on this property to create an open space preserve will benefit the region as a whole, the wildlife and ecosystem, and future residents.” It’s refreshing to see a team put the holistic needs of the community first.
RELATED Create More Diverse Housing Options With Accessory Dwelling Units Your Road Map to Off-Site Construction and Modular Homes Much Ado About ADUs—a Popular Housing Alternative Exploring Different Off-Site Construction Methods Off-site construction methods can vary depending on the needs of a project.
To make the process even more accessible, the USDA provides interactive maps that help potential homebuyers determine their eligibility for USDA loans. This article will delve into the world of USDA loan maps and explore how to unlock homeownership's potential. This is where interactive maps come into play.
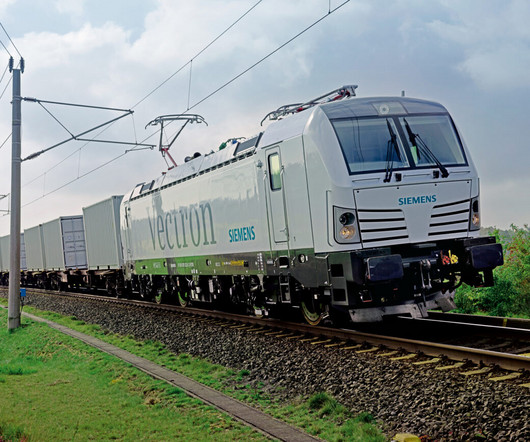
Tended’s solution has been developed and tested alongside Network Rail’s Safety Task Force to help create safer trackside environments by enabling organisations to map out safe working zones and site access points using incredibly precise geofencing technology.
The final maps create off-limits zones for new construction, and as an alternative could drive owners to retrofit existing buildings. Business Management'
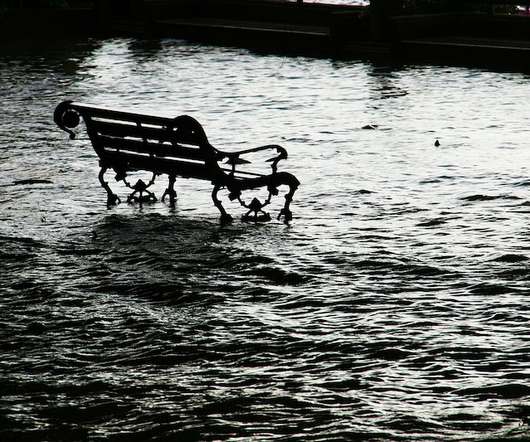
To assist in identifying areas susceptible to flooding, the Federal Emergency Management Agency (FEMA) developed flood maps in 1968 after Congress passed the National Flood Insurance Act. Zones B, C, and X are areas of low to moderate flood risk. Zone A has a high risk of flooding. Zone A has a high risk of flooding.
Excavation Root Causes: Prioritize tolerance zone safety, address contracts to provide adequate compensation for potholing and provide excavators with access to map visualizations.
By calculating exact multipliers and dividing spaces into precise geometric zones, contractors can eliminate awkward cuts and maintain perfect symmetry. Structural Grid Mapping Creating perfectly aligned patterns starts with establishing accurate reference grids.
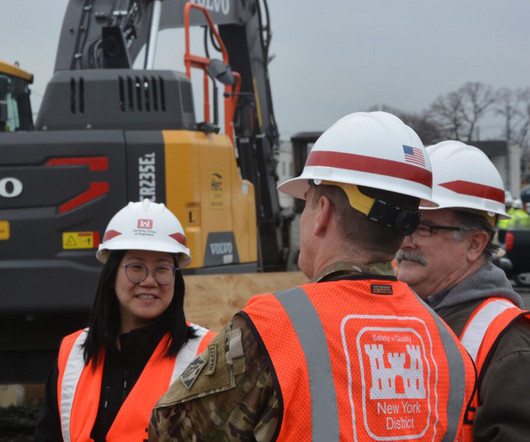
Safety Counseling New York District Commander, Mathew Luzzatto being shown a map of the FUSRAP Maywood Superfund Site in New Jersey in February 2023. In addition, zones are set up on the site to limit worker’s exposure and reduce or eliminate potential cross contamination. Credit: Nayelli Guerrero, Public Affairs, New York District.
California reinstituted an ambitious plan to study dangerous earthquake faults and create zoningmaps that could restrict development. In July, the California Geological Survey began to zone the Santa Monica fault, which is among 2,000 miles of fault lines statewide that still need to be mapped.
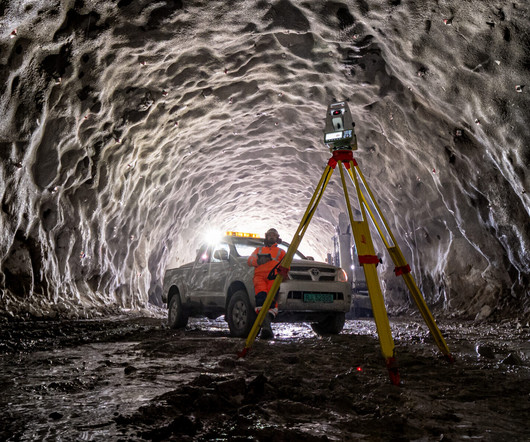
Once each blast is complete, and it’s safe to approach the blast zone, they use the total station to measure a grid of points on the tunnel face. That enables them to identify any overbreaks or underbreaks based on a pre-set, color-coded heat map. The software will compare the previous excavation scan to produce a heat map.
According to an article by a fire researcher, fire hazard maps do not take extreme weather patterns such as Santa Ana winds into account. The maps could also better address the vulnerabilities of what is actually exposed. Actually, vulnerable zones can extend well beyond those areas.
They shared how their designs start with Archicad, alongside a combination of Revu and Google Maps to go through potential ideas with the client. The schematics are then developed in Archicad, again using Google Maps to demonstrate thoughts and ideas, and masses in Archicad are pulled into Revu to add bespoke markups.
These aerial insights can generate 3D models and detailed maps that offer a new level of accuracy in project planning and execution. Drones can fly over hazardous zones, capturing high-resolution images and videos that provide insight into potential dangers, such as unstable structures, electrical issues, or environmental hazards.
Once plugged in, it can: Inject malware directly into your systems Provide remote access to criminals Compromise the entire network infrastructure Surveillance and Information Gathering Modern cybercriminals don’t just attackthey prepare.
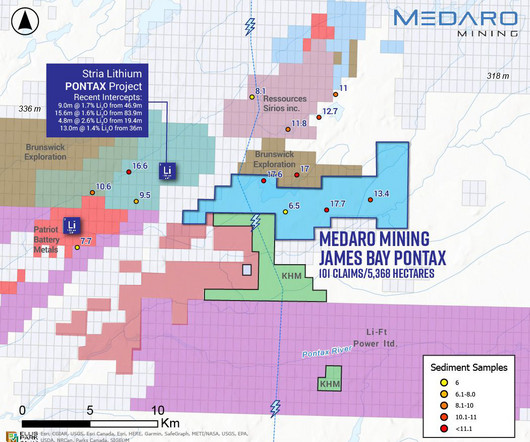
The Project is in a highly active prospective zone of James Bay Area, being situated 30 km south of Allkem Limited’s James Bay Lithium Project which has a published Mineral Reserve Estimate of 40.3Mt at 1.4% About 1 km west of the Project lies Stria Lithium Inc.’s
Organisations can map out safe working zones within an online Dashboard and attach devices to assets including plant, machinery and protection equipment.
GIS (Geographic Information System) surveying is a powerful tool that combines traditional land surveying techniques with geospatial technology to create detailed maps and databases. The data is then processed and analyzed with specialized software to create detailed maps and models of the surveyed area.
RELATED Energy-Efficiency Road Map: Whole-Building Envelope Sealing Indoor Air Quality Road Map: A Smart Range Hood Why Pay Attention to HVAC Faults? To answer these questions, Building America launched field studies in four climate zones. Environmental Protection Agency (EPA) and state agencies.
A surveyor is a professional who specialises in measuring, analysing and mapping the physical features of a property. Surveyors play a critical role in planning and executing construction projects, and they help ensure that buildings are built in the right locations and in compliance with local zoning laws and building regulations.
Image: courtesy Two Trails RELATED: Energy-Efficiency Road Map: Whole-Building Envelope Sealing Proper Design and Installation of the HVAC System Correctly installing the heating, ventilation, and air conditioning system ensures the comfort of the home’s occupants while reducing energy consumption and providing optimal indoor air quality.
This part of the process uses all the tools available, such as Geographic Information System (GIS) mapping, boots-on-the-ground specialists, and drones. It’s essential to report results and overlays of various data sets, including biodiversity hot spots and sensitive ecosystems, to facilitate informed decision-making in site selection.
With clear maps and guidelines, individuals can find the right solutions to manage their parking needs effectively. Specific zones are designated for different user groups, helping to manage space effectively. Each permit type allows parking in specific zones, ensuring convenient access to campus facilities. to 4:30 p.m.,
The last edition added a new climate zone to the map (Figure 1). A building’s location can be used to identify its climate zone—zero through eight—from warmest and driest to coldest. A building’s location can be used to identify its climate zone—zero through eight—from warmest and driest to coldest.
These help drivers navigate through construction zones and avoid delays. Detours will be clearly marked to ensure smooth flow around construction zones. Maps and Navigation Current maps for detours and closures can be accessed online. How can I find a map of the current I-196 construction zones?
Check Patterns He continued: “When the ignition is switched on, these cameras can virtually map out a five-metre ‘red zone’, a further away ‘amber zone’ and a ‘green zone’ that indicates a safe distance. The data for that machine can be accessed from our platform and the live journey of that vehicle can be checked.
This area is pivotal for various businesses and organizations, supported by its careful planning and zoning regulations. This location attracts many businesses due to its modern infrastructure and strategic zoning. Some key features include: Zoning Regulations : The area benefits from zoning laws tailored for mixed-use development.
Consider these traffic patterns: From the house to the grill area Between seating zones To and from garden features Identifying Key Transition Areas Smooth transitions make your outdoor space feel cohesive. Think about how different areas flow into each other, like from a dining spot to a fire pit zone.
It can also automatically detect when a truck enters or leaves defined pick-up and unloading zones to ensure accurate information. With 3D map imagery, operators can view where the load is picked up and the path to unload and return. Drivers come onto the site, quickly enter basic information, and get to work.
Another change is the revised climate zonemap. Building envelope criteria has changed along with those climate zones,” said Shold. Now, all must comply with Minnesota Rules 1323 ([link] as an option, including residential buildings of less than three stories.
Factors are often evaluated in a geographic information systems (GIS) screening to visually map data sets to help identify Areas of Interest. To use an interactive version of this map, click here. Geological Survey (USGS) by dividing land area into seismic (ground acceleration) zones based on historical events. Wildfire Risk.
Building energy use, influenced by climate zone-specific code guidelines and building owner decisions, directly impacts mechanical system designs. The 2021 version of the International Energy Conservation Code ( IECC ) revised its climate zonemap to reflect rising average temperatures across the U.S.
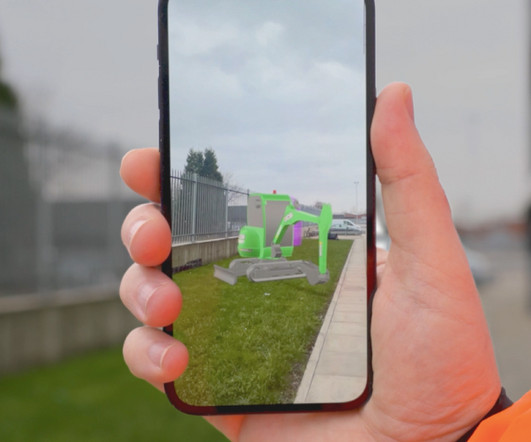
Users will have the ability to place realistic 3D models of equipment in their intended locations, map out the safety zones and view diagrams, ensuring optimal placement and incorporation into their projects before the start of the construction phase.
We organize all of the trending information in your field so you don't have to. Join 79,000+ users and stay up to date on the latest articles your peers are reading.
You know about us, now we want to get to know you!
Let's personalize your content
Let's get even more personalized
We recognize your account from another site in our network, please click 'Send Email' below to continue with verifying your account and setting a password.


Let's personalize your content